

0 引言
1 分析目标的确定
表1 分析对象压驱压力梯度和压裂压力梯度表Table 1 Pressure gradients of pressure drive and fracturing of the analyzed objects |
| 井 号 | 层数 | 层位 | 储层 中深/ m | 排量/ (m3·min-1) | 管柱 摩阻/ MPa | 地面压驱压力/ MPa | 地面压裂压力/ MPa | 井底压 驱压力/ MPa | 井底压 裂压力/ MPa | 井底压驱 梯度/ (MPa·m-1) | 井底压裂 梯度/ (MPa·m-1) |
|---|---|---|---|---|---|---|---|---|---|---|---|
| 1 | 1 | L2Ⅰ | 2 353.90 | 6.00 | 10.36 | 33.00 | 43.00 | 46.89 | 56.89 | 0.019 9 | 0.024 2 |
| 2 | L2Ⅱ | 2 427.70 | 6.00 | 10.58 | 21.00 | 27.00 | 44.43 | 41.43 | 0.018 3 | 0.017 1 | |
| 2 | 1 | L2Ⅱa | 2 521.36 | 4.40 | 12.78 | 45.00 | 43.00 | 58.19 | 59.19 | 0.023 1 | 0.023 5 |
| 2 | L2Ⅱb | 2 561.97 | 5.00 | 16.47 | 45.00 | 48.00 | 54.92 | 55.00 | 0.021 4 | 0.021 5 | |
| 3 | 1 | L2Ⅱa | 2 228.48 | 6.00 | 11.69 | 36.00 | 40.00 | 47.26 | 51.26 | 0.021 2 | 0.023 0 |
| 2 | L2Ⅱb | 2 275.15 | 6.00 | 11.66 | 36.00 | 38.00 | 47.77 | 49.77 | 0.021 0 | 0.021 9 | |
| 3 | L2Ⅱc | 2 321.65 | 6.00 | 11.96 | 40.00 | 40.50 | 51.95 | 52.45 | 0.022 4 | 0.022 6 | |
| 4 | 1 | L2Ⅱa+b | 2 560.82 | 5.00 | 10.61 | 34.00 | 37.00 | 50.00 | 52.77 | 0.019 5 | 0.020 6 |
| 2 | L2Ⅱc | 2 617.81 | 5.00 | 9.03 | 32.00 | 38.00 | 51.00 | 55.93 | 0.019 5 | 0.021 4 | |
| 5 | 1 | L2Ⅱa+b+c | 2 184.96 | 6.00 | 10.00 | 22.11 | 28.00 | 42.00 | 44.00 | 0.019 2 | 0.020 1 |
2 影响因素关联度及权重的确定
2.1 数据处理
表2 目标因素和影响因素无因次化处理结果表Table 2 Dimensionless processing results of target factors and influencing factors |
| 目标因素 | 影响因素 | |||||||||||
|---|---|---|---|---|---|---|---|---|---|---|---|---|
| 压驱压力 梯度 | 压裂压力 梯度 | M1 | M2 | M3 | M4 | M5 | M6 | M7 | M8 | M9 | M10 | M11 |
| 0.968 | 1.121 | 0.472 | 0.558 | 0.723 | 0.451 | 0.713 | 0.927 | 1.029 | 0.970 | 0.655 | 0.675 | 1.083 |
| 0.891 | 0.792 | 1.424 | 1.686 | 1.566 | 1.803 | 1.759 | 1.008 | 1.167 | 0.970 | 0.655 | 1.232 | 1.083 |
| 1.124 | 1.089 | 0.576 | 0.411 | 1.446 | 0.518 | 0.295 | 0.870 | 0.954 | 1.370 | 1.388 | 0.821 | 0.794 |
| 1.041 | 0.996 | 1.294 | 0.926 | 1.687 | 0.778 | 0.999 | 0.847 | 0.941 | 1.370 | 1.388 | 1.150 | 0.903 |
| 1.032 | 1.065 | 0.535 | 0.489 | 0.602 | 0.704 | 0.171 | 1.113 | 1.079 | 1.142 | 1.120 | 0.739 | 1.083 |
| 1.022 | 1.014 | 1.133 | 1.034 | 0.843 | 1.239 | 0.761 | 1.030 | 1.029 | 1.142 | 1.120 | 1.006 | 1.083 |
| 1.090 | 1.047 | 0.772 | 0.708 | 0.482 | 0.817 | 0.480 | 0.883 | 0.966 | 1.142 | 1.120 | 0.821 | 1.083 |
| 0.949 | 0.954 | 1.246 | 1.264 | 0.843 | 1.268 | 1.370 | 1.221 | 1.004 | 1.027 | 0.974 | 1.134 | 0.903 |
| 0.949 | 0.991 | 0.747 | 0.758 | 0.241 | 0.732 | 0.704 | 1.093 | 0.903 | 1.027 | 0.974 | 0.698 | 0.903 |
| 0.934 | 0.931 | 1.801 | 2.166 | 1.566 | 1.690 | 2.749 | 1.008 | 0.929 | 1.142 | 0.609 | 1.724 | 1.083 |
2.2 斯皮尔曼相关系数法
表3 斯皮尔曼相关系数计算结果表Table 3 Calculation results of Spearman correlation coefficients |
| 名称 | 压驱 梯度 | 压裂 梯度 | M1 | M2 | M3 | M4 | M5 | M6 | M7 | M8 | M9 | M10 | M11 |
|---|---|---|---|---|---|---|---|---|---|---|---|---|---|
| 压驱梯度 | 1.00 | 0.75 | -0.50 | -0.77 | -0.15 | -0.61 | -0.74 | -0.52 | -0.12 | -0.55 | 0.88 | -0.37 | -0.31 |
| 压裂梯度 | 0.75 | 1.00 | -0.88 | -0.90 | -0.40 | -0.89 | -0.79 | -0.32 | 0.14 | -0.44 | 0.48 | -0.76 | -0.03 |
| M1 | -0.50 | -0.88 | 1.00 | 0.90 | 0.68 | 0.90 | 0.85 | -0.04 | -0.18 | 0.29 | -0.28 | 0.95 | 0.07 |
| M2 | -0.77 | -0.90 | 0.90 | 1.00 | 0.48 | 0.92 | 0.94 | 0.26 | -0.05 | 0.37 | -0.58 | 0.80 | 0.25 |
| M3 | -0.15 | -0.40 | 0.68 | 0.48 | 1.00 | 0.42 | 0.65 | -0.42 | 0.00 | 0.20 | 0.02 | 0.81 | -0.14 |
| M4 | -0.61 | -0.89 | 0.90 | 0.92 | 0.42 | 1.00 | 0.78 | 0.26 | 0.09 | 0.10 | -0.41 | 0.84 | 0.28 |
| M5 | -0.74 | -0.79 | 0.85 | 0.94 | 0.65 | 0.78 | 1.00 | 0.06 | -0.06 | 0.50 | -0.59 | 0.79 | 0.16 |
| M6 | -0.52 | -0.32 | -0.04 | 0.26 | -0.42 | 0.26 | 0.06 | 1.00 | 0.26 | -0.16 | -0.38 | -0.10 | 0.16 |
| M7 | -0.12 | 0.14 | -0.18 | -0.05 | 0.00 | 0.09 | -0.06 | 0.26 | 1.00 | -0.49 | -0.10 | -0.05 | 0.54 |
| M8 | -0.55 | -0.44 | 0.29 | 0.37 | 0.20 | 0.10 | 0.50 | -0.16 | -0.49 | 1.00 | -0.50 | 0.11 | -0.25 |
| M9 | 0.88 | 0.48 | -0.28 | -0.58 | 0.02 | -0.41 | -0.59 | -0.38 | -0.10 | -0.50 | 1.00 | -0.17 | -0.50 |
| M10 | -0.37 | -0.76 | 0.95 | 0.80 | 0.81 | 0.84 | 0.79 | -0.10 | -0.05 | 0.11 | -0.17 | 1.00 | 0.06 |
| M11 | -0.31 | -0.03 | 0.07 | 0.25 | -0.14 | 0.28 | 0.16 | 0.16 | 0.54 | -0.25 | -0.50 | 0.06 | 1.00 |
2.3 灰色关联分析法
表4 灰色关联分析法计算结果表Table 4 GRA calculation results |
| 名称 | 影响因素 | M1 | M2 | M3 | M4 | M5 | M6 | M7 | M8 | M9 | M10 | M11 |
|---|---|---|---|---|---|---|---|---|---|---|---|---|
| 压驱压力 梯度 | 相关性 | 0.702 0 | 0.716 4 | 0.685 9 | 0.7135 | 0.663 5 | 0.943 3 | 0.923 3 | 0.861 7 | 0.812 0 | 0.799 4 | 0.796 4 |
| 权重 | 8.15% | 8.31% | 7.96% | 8.28% | 7.70% | 10.95% | 10.71% | 10.00% | 9.42% | 9.28% | 9.24% | |
| 压裂压力 梯度 | 相关性 | 0.708 2 | 0.664 1 | 0.642 0 | 0.675 4 | 0.607 5 | 0.861 1 | 0.866 7 | 0.892 6 | 0.829 0 | 0.773 8 | 0.782 6 |
| 权重 | 8.53% | 8.00% | 7.73% | 8.13% | 7.32% | 10.37% | 10.44% | 10.75% | 9.98% | 9.32% | 9.43% |
3 压驱压裂施工压力预测
3.1 线性回归(最小二乘法)
表5 压驱压裂裂缝延伸压力梯度多项式计算系数表Table 5 Multinomial coefficients for calculating pressure gradient of fracture extension in pressure drive and fracturing |
| 变量 | 单位 | 压驱压力梯度计算系数 | 压裂压力梯度计算系数 |
|---|---|---|---|
| 常数 | 0.022 198 2 | 0.039 773 0 | |
| 储层平均GR值(M6) | API | -0.000 034 9 | -0.000 045 9 |
| 砂岩平均GR值(M7) | API | -0.000 007 5 | -0.000 105 1 |
| 地层倾角(M8) | (°) | -0.000 083 8 | -0.000 902 3 |
| 井斜角(M9) | (°) | 0.000 099 9 | 0.000 117 4 |
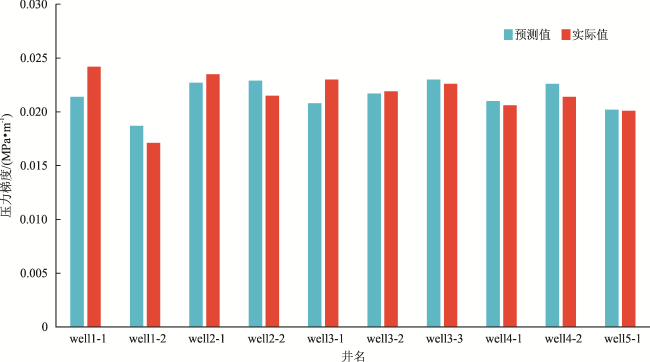
表6 线性回归计算结果与实际值对比表(压驱压力梯度)Table 6 Comparison of linear regression calculation results with actual values (pressure gradient in pressure drive) |
| 井名 | well1-1 | well1-2 | well2-1 | well2-2 | well3-1 | well3-2 | well3-3 | well4-1 | well4-2 | well5-1 |
|---|---|---|---|---|---|---|---|---|---|---|
| 预测结果/(MPa·m-1) | 0.019 5 | 0.019 1 | 0.022 6 | 0.022 7 | 0.020 5 | 0.020 9 | 0.021 6 | 0.019 6 | 0.020 2 | 0.018 9 |
| 实际值/(MPa·m-1) | 0.019 9 | 0.018 3 | 0.023 1 | 0.021 4 | 0.021 2 | 0.021 0 | 0.022 4 | 0.019 5 | 0.019 5 | 0.019 2 |
| 偏差率 | 2% | -4% | 2% | -6% | 3% | 0 | 4% | -1% | -4% | 2% |
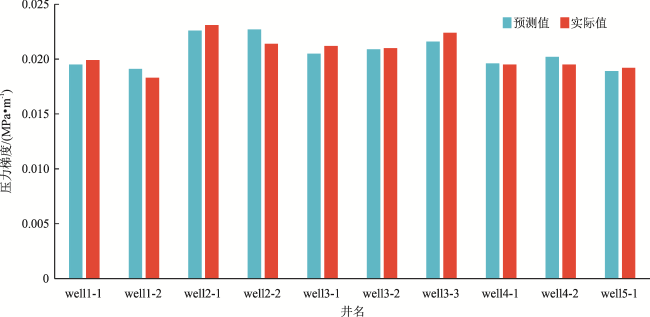
图2 线性回归计算结果与实际值对比图(压驱压力梯度)Fig. 2 Comparison of linear regression calculation results with actual values (pressure gradient in pressure drive) |
表7 线性回归计算结果与实际值对比表(压裂压力梯度)Table 7 Comparison of linear regression calculation results with actual values (pressure gradient in fracturing) |
| 井名 | well1-1 | well1-2 | well2-1 | well2-2 | well3-1 | well3-2 | well3-3 | well4-1 | well4-2 | well5-1 |
|---|---|---|---|---|---|---|---|---|---|---|
| 预测结果/(MPa·m-1) | 0.021 4 | 0.018 7 | 0.022 7 | 0.022 9 | 0.020 8 | 0.021 7 | 0.023 0 | 0.021 0 | 0.022 6 | 0.020 2 |
| 实际值/(MPa·m-1) | 0.024 2 | 0.017 1 | 0.023 5 | 0.021 5 | 0.023 0 | 0.021 9 | 0.022 6 | 0.020 6 | 0.021 4 | 0.020 1 |
| 偏差率 | 12% | -10% | 3% | -7% | 10% | 1% | -2% | -2% | -5% | 0 |
3.2 机器学习回归(梯度下降法)
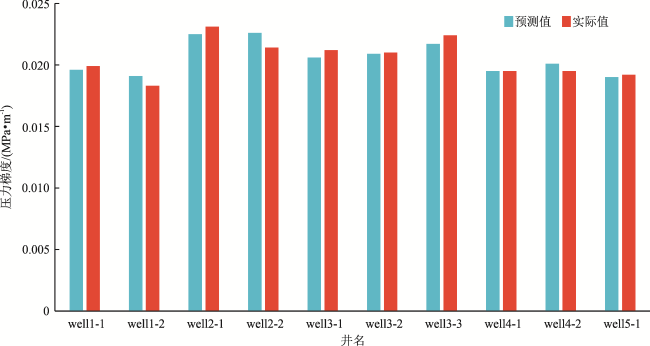
图4 机器学习回归计算结果与实际值对比图(压驱压力梯度)Fig. 4 Comparison of machine learning regression calculation results with actual values (pressure gradient in pressure drive) |
表8 机器学习回归计算结果与实际值对比表(压驱压力梯度)Table 8 Comparison of machine learning regression calculation results with actual values (pressure gradient in pressure drive) |
| 井名 | well1-1 | well1-2 | well2-1 | well2-2 | well3-1 | well3-2 | well3-3 | well4-1 | well4-2 | well5-1 |
|---|---|---|---|---|---|---|---|---|---|---|
| 预测结果/ (MPa·m-1) | 0.019 6 | 0.019 1 | 0.022 5 | 0.022 6 | 0.020 6 | 0.020 9 | 0.021 7 | 0.019 5 | 0.020 1 | 0.019 0 |
| 实际值/ (MPa·m-1) | 0.019 9 | 0.018 3 | 0.023 1 | 0.021 4 | 0.021 2 | 0.021 0 | 0.022 4 | 0.019 5 | 0.019 5 | 0.019 2 |
| 偏差率 | 2% | -4% | 3% | -6% | 3% | 0 | 3% | 0 | -3% | 1% |
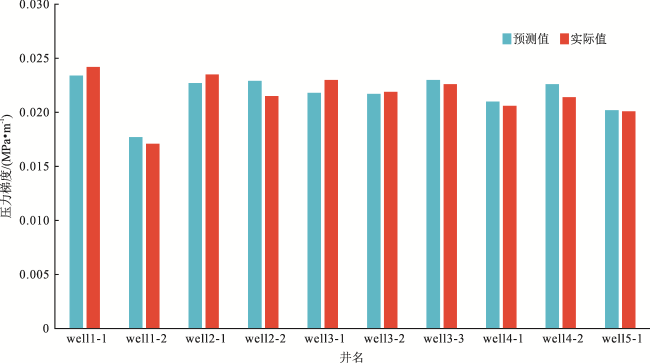
图5 机器学习回归计算结果与实际值对比图(压裂压力梯度)Fig. 5 Comparison of machine learning regression calculation results with actual values (pressure gradient in fracturing) |
表9 机器学习回归计算结果与实际值对比表(压裂压力梯度)Table 9 Comparison of machine learning regression calculation results with actual values (pressure gradient in fracturing) |
| 井名 | well1-1 | well1-2 | well2-1 | well2-2 | well3-1 | well3-2 | well3-3 | well4-1 | well4-2 | well5-1 |
|---|---|---|---|---|---|---|---|---|---|---|
| 预测结果/(MPa·m-1) | 0.023 4 | 0.017 7 | 0.022 7 | 0.022 9 | 0.021 8 | 0.021 7 | 0.023 0 | 0.021 0 | 0.022 6 | 0.020 2 |
| 实际值/(MPa·m-1) | 0.024 2 | 0.017 1 | 0.023 5 | 0.021 5 | 0.023 0 | 0.021 9 | 0.022 6 | 0.020 6 | 0.021 4 | 0.020 1 |
| 偏差率 | 3% | -4% | 3% | -7% | 5% | 1% | -2% | -2% | -5% | 0 |
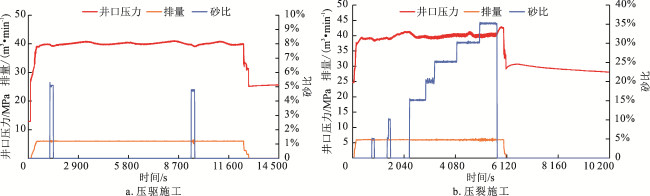
4 应用实例
表10 A1井压力梯度与施工压力预测表Table 10 Predicted values of pressure gradient and operation pressure for Well A1 |
| 名称 | 压驱压力梯度/(MPa·m-1) | 压裂压力梯度/(MPa·m-1) | 压驱施工压力/MPa | 压裂施工压力/MPa |
|---|---|---|---|---|
| 线性回归 | 0.021 63 | 0.023 54 | 37.21 | 40.50 |
| 机器学习 | 0.022 18 | 0.023 06 | 38.47 | 41.61 |
表11 两种方法预测压驱和压裂施工压力值对比表Table 11 Predicted values of operation pressure in pressure drive and fracturing by two methods |
| 方法类型 | 线性回归 | 机器学习 |
|---|---|---|
| 预测值/MPa | 37.21 | 38.47 |
| 实际值/MPa | 40.9 | 40.90 |
| 偏差值/MPa | 3.69 | 2.43 |
| 偏差率 | 9.02% | 5.94% |