

0 引言
1 泸州区块深层页岩气储层压裂概况
1.1 储层地质特征
表1 泸州区块深层页岩气储层主要地质参数表Table 1 Main geological parameters of deep shale gas reservoirs in the Luzhou block |
| 参数 | 数据范围 |
|---|---|
| Ⅰ类储层厚度/m | 6~18 |
| 总有机碳含量 | 3.0%~6.5% |
| 总含气量/(m3·t-1) | 3.0~9.0 |
| 孔隙度 | 4.0%~8.6% |
| 渗透率/nD | 60~180 |
| 杨氏模量/GPa | 35~45 |
| 泊松比 | 0.2~0.3 |
| 最小水平主应力/MPa | 85~100 |
| 水平应力差/MPa | 10~20 |
| 地层温度/℃ | 120~140 |
注:渗透率单位采用纳达西(nD),而不是常用的毫达西(mD),1 mD = 1×10⁻³ μm2,1 nD = 1×10⁻⁶ mD = 1×10⁻⁹ μm2,下同;因页岩储层的渗透率远低于常规储层,故采用更小的渗透率单位,即nD来表征。 |
1.2 压后效果评价
表2 泸州区块深层页岩气井压裂前后相关参数及储层改造效果综合评价表Table 2 Relevant parameters before and after fracturing and comprehensive evaluation of reservoir stimulation effect of deep shale gas wells in the Luzhou block |
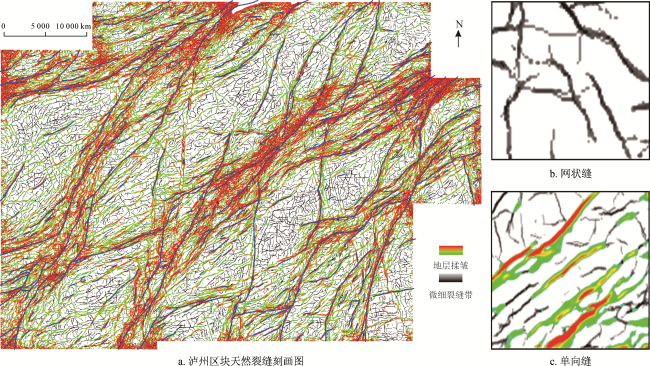
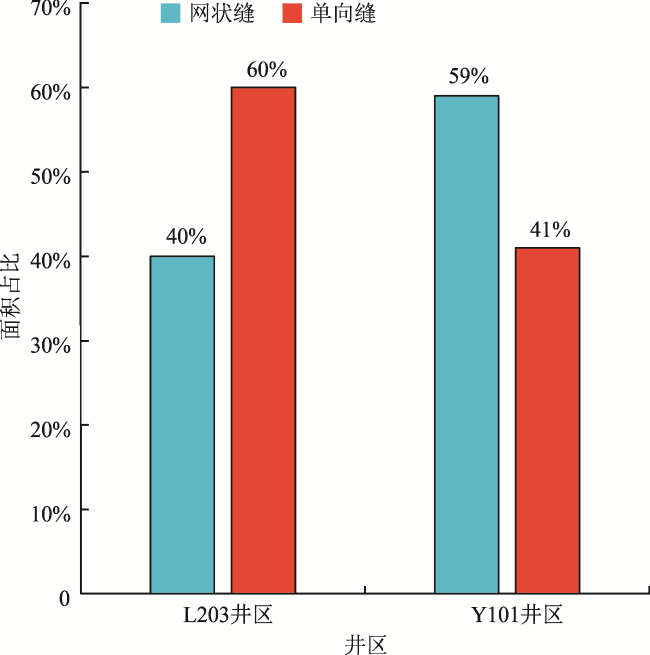
| 部署 | 天然裂缝类型 | 网状缝为主 (占比83%) | 网状缝(占比57.5%) 单向缝(占比42.5%) | 单向缝为主 (占比78%) |
|---|---|---|---|---|
| 钻井 | 铂金靶体钻遇长度/m | >1 700 | >1 500 | <1 500 |
| 压裂 | 主体工艺 | 段内多簇(6~8簇)、大排量(18 m3/min)、 大液量(30~35 m3/m)、大砂量(3.0~3.5 t/m) | ||
| 套变频率 | 21% | 33% | 51% | |
| 压后/生产 | EUR/108 m3 | ≥1.33 | [1.00, 1.33) | <1.00 |
2 模型构建及缝网需求研究
2.1 模型构建及参数设置
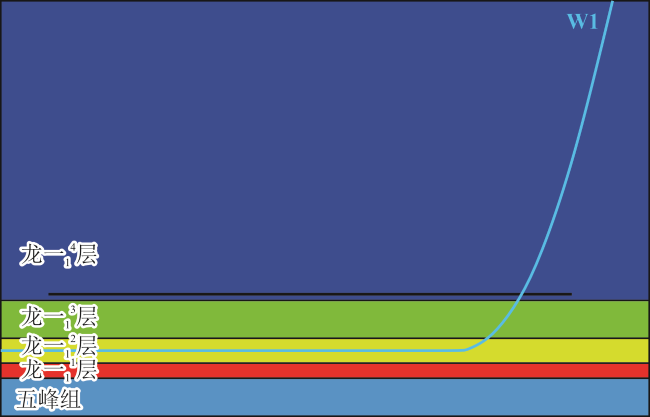
图3 泸州区块深层页岩气储层三维概念模型图Fig. 3 3D conceptual model of deep shale gas reservoir in the Luzhou block |
表3 泸州区块深层页岩气井水力压裂数值模拟模型输入参数表Table 3 Input parameters of numerical simulation model of hydraulic fracturing for deep shale gas wells in the Luzhou block |
| 输入参数 | 数值 |
|---|---|
| 平均滑溜水滤失系数 | 8 |
| 平均胶液滤失系数 | 1.5 |
| 最小水平主应力预测与实际差值/MPa | 4.5 |
| 滑溜水高排量摩阻/(Pa·m-1) | 4 761 |
| 胶液高排量摩阻/(Pa·m-1) | 5 725 |
| 原始地层压力/MPa | 82 |
| 油藏温度/℃ | 138 |
| 气相对密度/(kg·m-3) | 0.6 |
| 束缚水饱和度 | 0.45% |
| 束缚气饱和度 | 0.10% |
| 动用有效厚度/m | 17 |
2.2 压裂缝网形态需求
3 不同裂缝模式下的压裂参数优化
3.1 网状缝模式
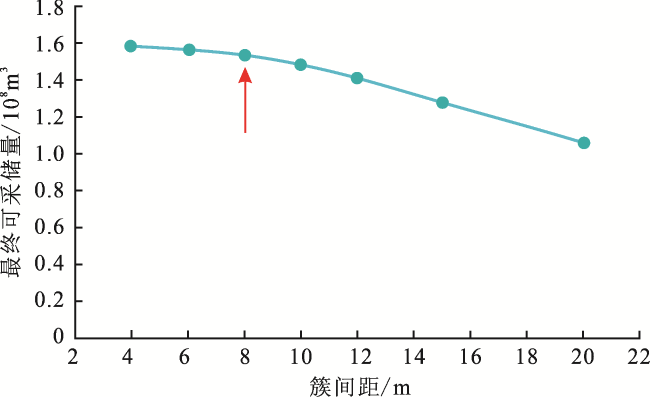
图4 气井可采储量与簇间距关系曲线图(渗透率120 nD)Fig. 4 Relation curve of EUR versus cluster spacing (permeability: 120 nD) |
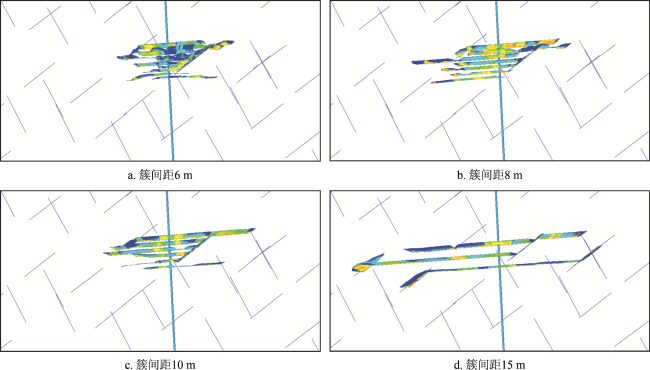
图5 不同簇间距条件下应力阴影对压裂缝网形态的影响模拟结果图Fig. 5 Simulation results of stress shadow effects on hydraulic fracture network morphology under different cluster spacing conditions |
表4 不同渗透率对应最优簇间距模拟结果表Table 4 Simulation results of optimal cluster spacing under different permeability conditions |
| 渗透率/nD | 60 | 120 | 180 | 240 | 300 |
|---|---|---|---|---|---|
| 最优簇间距/m | 6 | 8 | 10 | 12 | 15 |
表5 网状缝模式下不同的最小水平主应力对应最优用液强度模拟结果表Table 5 Simulation results of optimal fracturing fluid intensity under different minimum horizontal principal stress conditions for the type of network fracture |
| 最小水平主应力/ MPa | 最优用液强度/ (m3·m-1) | 最优加砂强度/ (t·m-1) |
|---|---|---|
| 85 | 25 | 2.7 |
| 90 | 30 | 3.1 |
| 95 | 35 | 3.5 |
| 100 | 40 | 3.9 |
| 105 | 45 | 4.3 |
3.2 单向缝模式
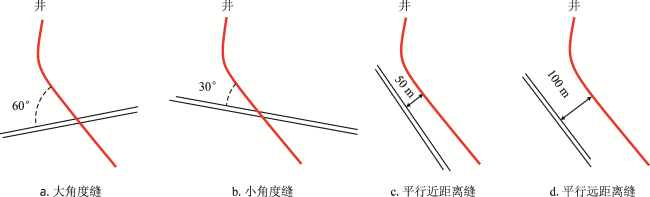
3.2.1 大角度缝
3.2.2 小角度缝
3.2.3 平行近距离缝与平行远距离缝
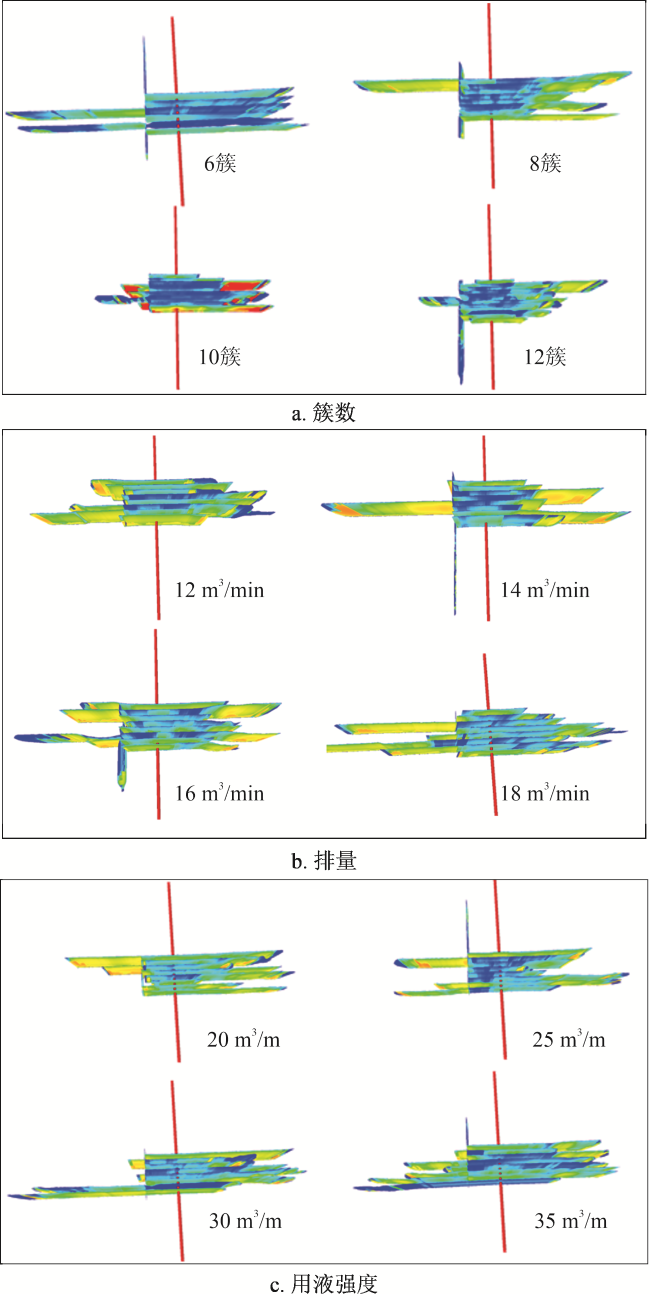
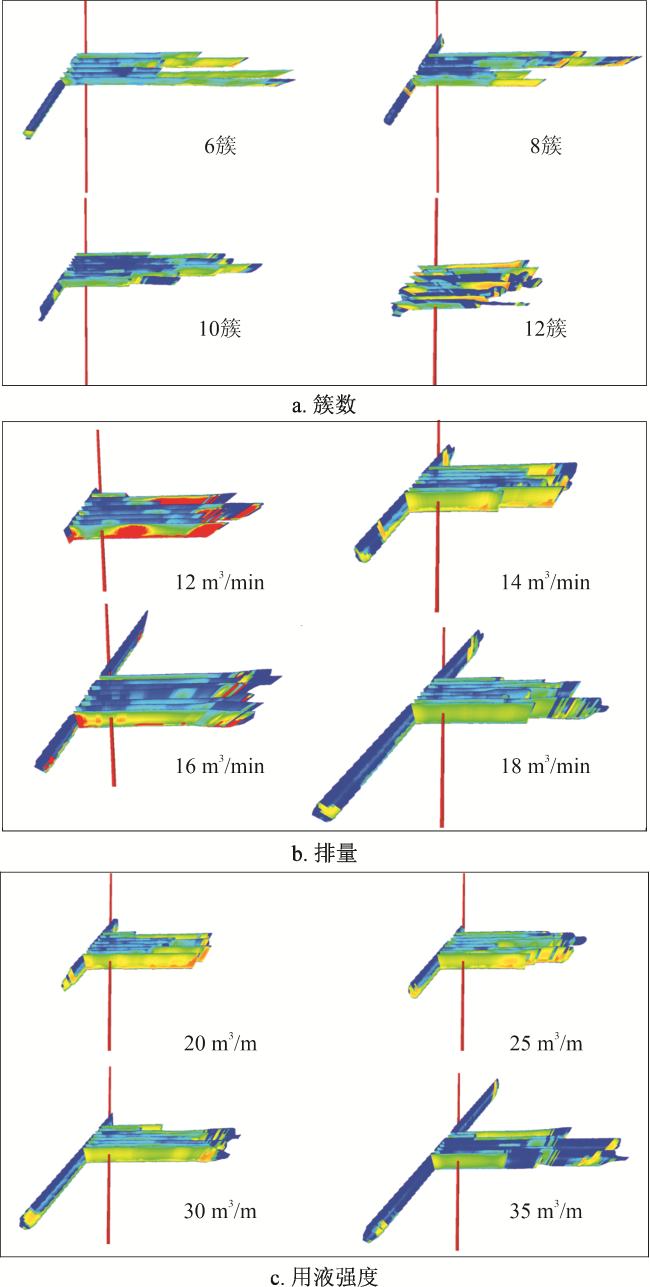
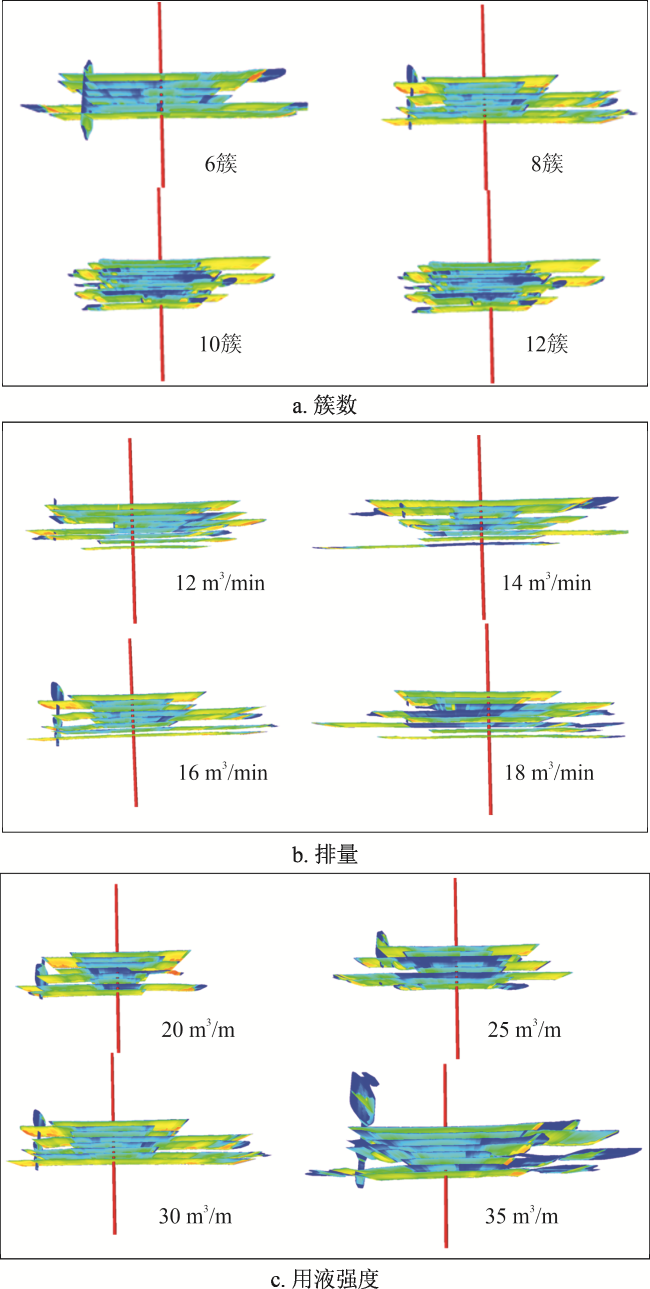
图9 平行近距离缝在不同压裂工程参数下的水力裂缝模拟形态图Fig. 9 Hydraulic fracture morphology simulation of parallel proximal fractures under different fracturing engineering parameters |
3.2.4 单向缝模式下的差异化压裂参数模板
表6 研究区在单向缝模式下的差异化压裂参数模板Table 6 Differentiated fracturing parameter templates under the type of unidirectional fracture |
| 天然裂缝类型 | 簇数 | 排量/ (m3·min-1) | 用液强度/ (m3·m-1) | 加砂强度/ (t·m-1) |
|---|---|---|---|---|
| 大角度缝 | 12 | 14 | 20 | 2.0~3.5,在确保施工安全条件下最大化加砂,确保压裂缝网导流能力 |
| 小角度缝 | 10 | 16 | 25 | |
| 平行近距离缝 | 6 | 18 | 35 | |
| 平行远距离缝 | 6 | 18 | 30 |
4 现场应用
表7 应用井的压裂参数优化及施工情况统计表Table 7 Fracturing parameter optimization and operation of test well |
| 天然裂缝类型 | 段号 | 阶段 | 簇间距/ m | 簇数 | 排量/ (m3·min-1) | 用液强度/ (m3·m-1) |
|---|---|---|---|---|---|---|
| 基质+网状缝 | 1~6、 9~12、 16~21 | 设计范围 | 8.0~10.0 | 6~8 | 18.0 | 30.00~33.00 |
| 实施情况 | 8.0~10.0 | 6~8 | 17.5~18.0 | 31.02 | ||
| 大角度缝 | 7~8 | 设计范围 | 6.0~8.0 | 12 | 14.0 | 20.00 |
| 实施情况 | 5.9 | 12 | 14.0 | 22.16 | ||
| 小角度缝 | 13~15、 22~28 | 设计范围 | 6.0~8.0 | 10 | 16.0 | 25.00 |
| 实施情况 | 6.8 | 10 | 14.0~16.0 | 24.88 | ||
| 平行近距离缝 | 29~30 | 设计范围 | 8.0~10.0 | 6 | 18.0 | 35.00 |
| 实施情况 | 8.8 | 6 | 18.0 | 33.30 |